Introduction
California’s vehicle accident statistics highlight a serious public safety issue. There are around 500,000 crashes every year. They result in thousands of fatalities and a huge number of injuries. Data comes from organizations like the Office of Traffic Safety and SWITRS.
It shows that issues including speeding, DUI, & distracted driving have contributed to an increase in mortality, particularly since the pandemic. Accident rates are influenced by economic activity, temporal patterns, and high-risk areas. Each year, these incidents result in billions of dollars’ worth of medical expenses, insurance premiums, & lost productivity.
Car accidents in California: Statistical overview
- 500,000 collisions every year.
- 1,370 crashes every day.
- People injured each year: 250k.
- 3,600 deaths per year. Ten fatalities every day.
The numbers have been increasing fast post-2020. In the early days of the pandemic, accidents had dropped. Next came a surge. An enormous surge.
2020-2021 was a tough period. A 10.7% rise in accident deaths was recorded. Greater than the average for the country. This is more than the majority of states. California routinely ranks in the top five in the country for injuries sustained in auto accidents.
These are more than simply statistics, though. Every number denotes a person whose life has been irrevocably altered.
Injury collisions happen on California roadways every three minutes. This data is given by the Statewide Integrated Traffic Records System (SWITRS) of the California Highway Patrol.
Auto accidents are a common occurrence in today’s world. Dangerously packed roads and high-speed crashes are inevitable since many of our towns and cities are built on the use of private vehicles. Because of this, the federal and state governments have strong initiatives in place to collect and analyze data related to auto accidents. Experts rely on California car accident statistics to analyze road safety trends in the state.
Reliable Resources for Information about Auto Accidents in California
- The Office of Traffic Safety in California
- California Highway Patrol’s SWITRS (Statewide Integrated Traffic Records System)
- California Highway Patrol’s SWITRS report is a thorough & trustworthy source of information
What You Should Know
The following is a summary of its most noteworthy data regarding road incidents in California:
- 3,582 crashes gave rise to 3,904 fatalities.
- Multiple fatalities in a fatal collision in traffic: Probability is 8%.
- 193,564 crashes resulted in 277,160 injuries.
Other important details are also included in the SWITRS study.
- Ten-year traffic data summary
- Monthly summaries of traffic accident fatalities and injuries (2008 through 2017)
- A breakdown of fatalities & injuries by kind of intersection. Includes weather, day of the week, & hour of the day.
- A breakdown of fatalities & injuries by county
- Relevant demographic data, including miles driven, the number of authorized drivers, and car registrations
- Details regarding the monetary consequences of road accidents, including property damage
- Statistics for typical safety issues, like the use of seat belts or alcohol consumption
- Separate sections for motorcycle and truck accidents
The most recent data in the SWITRS report is already 5 years old, which is a problem. Although this research offers excellent insight into California’s long-term crash trends, it does not provide precise information on whether those patterns have changed recently.
Related Read: Is California a No-Fault State for Car Accidents?
Car Accident Trends in California Over Time
There are a number of clear trends. They show how fatal crashes in California have changed over the last ten years. Fatal accidents in California gradually decreased between 2005 & 2010 before starting a concerning increasing trend in 2015. This rising trend intensified dramatically during the pandemic.
Driving Behavior Affected by Pandemic
The California Office of Traffic Safety gave important insights. There were fewer cars on California highways during the initial pandemic lockdowns, but the empty roads paradoxically encouraged riskier driving practices. There was an over 87% rise in high-speed incidents (above 100 mph) throughout this time.
Seasonal and Temporal Trends
This is when things become complicated. When compared to workday or daytime incidents, weekend accidents, especially those that happen between 11 PM & 3 AM, consistently have greater death rates. Despite general variations in the number of accidents, this time distribution has stayed largely stable. Reports on California car accident statistics highlight the increase in nighttime accidents.
Well, I might add that seasonal changes also have an impact, albeit maybe not in the manner in which most people anticipate. Contrary to common assumption, most California counties have greater accident rates during the summer than during the winter, with the exception of mountainous areas where winter conditions make driving dangerous.
Economic Relationships
When economic conditions and car miles traveled are associated with traffic mortality by year, alarming trends emerge. According to the data, there is a 0.43% rise in road deaths for each one percentage point rise in employment, indicating a connection between economic activity & accident rates.
Regional Analysis: California’s High-Risk Areas
Los Angeles.
With a mean of 24 collisions each year, Devonshire Street & Reseda Boulevard is the most dangerous junction in California.
Despite making up only 10% of the state’s roads, car accidents in the city of Los Angeles represent roughly 25% of all crashes in the state. That is out of proportion. That is concerning. There are disparities in the distribution of dangerous roads throughout California. The highest rate of pedestrian accidents is found in San Francisco. The stretch of Highway 99 (Sacramento) is the notorious “bloodbath.
After twenty years of discussing these figures, I can assure you that the most annoying assumption is that cities are inherently more dangerous. Due to faster speeds, fewer security features on conventional roads, and lengthier emergency response times, many rural areas have far higher death rates per mile traveled. In raw numbers, this subtlety is lost.
There are a number of “accident corridors” where collision rates are more than twice as high as the state average, according to the California Data Exchange Center. These are parts of Highway 1 in the Central Coast, I-15 between San Bernardino and the Nevada border, & I-5 in Sacramento.
California’s Top Causes of Auto Accidents
If I talk to a person who’s been in a catastrophic accident, “What do you know?” They nearly always tell me what I didn’t expect. The data reveals, however, that the causes of the auto accident are as expected and have not changed significantly over the years.
1. Driving While Distracted
Let me share with you what the state of the roads in California is today. Distracted driving causes more accidents than any other. The phone calls and text messages? They are responsible for approximately twenty-three percent of all accidents. Driving for five seconds at 55 mph while looking at your cell phone can also be very dangerous. It is the same as driving in a soccer field blindfolded.
2. DUI
Awareness programs have been in place. The issue of drunk driving continues to be a problem. Alcohol plays a role in numerous road fatalities (29 percent in California). That’s nearly one-third! In contrast to popular belief, the majority of DUI incidents occur between 6 and 9 PM, during what highway safety professionals refer to as “happy hour” wrecks.
3. Speeding
Speeding comes next. Surely we’ve all done it? Pushing slightly above the limit while running just a few minutes late. 26 percent of all fatal accidents are caused by speeding. The likelihood of dying in an accident doubles for each ten mph increase beyond 50 mph. California car accident statistics are used to study the effects of speeding & reckless driving.
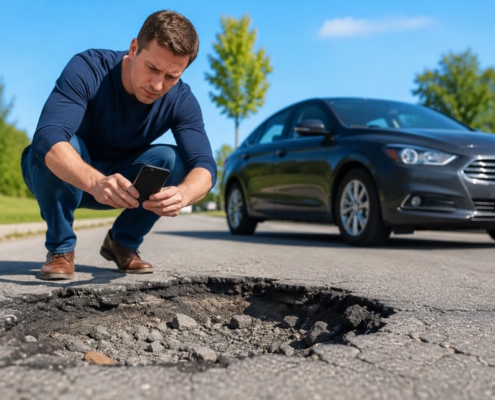
4. Weather-related
Weather-related accidents increase during California’s rainfall season. It is more prevalent in places that aren’t used to consistent rain. Drivers in Southern California are infamously ill-prepared for wet roads. There is a roughly 200% increase in accident rates during the first substantial downpour following a dry spell.
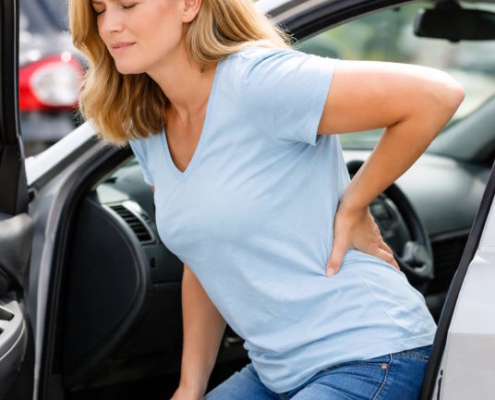
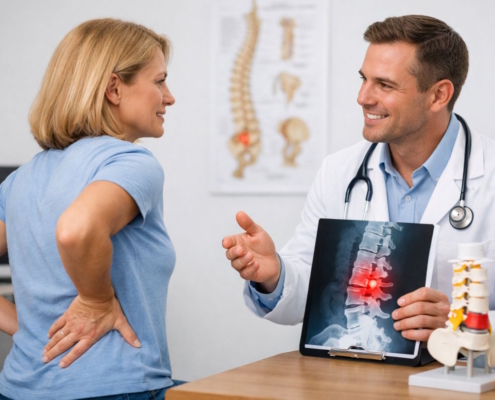
Typical Injury Trends
Predictable trends also apply to common vehicle accident injuries: side-impact incidents disproportionately cause head and chest trauma, whereas rear-end collisions cause whiplash in almost 80% of victims. Insurance companies monitor California car accident statistics when calculating premium rates.
Comprehensive information regarding these causes of accidents is provided by the National Highway Traffic Safety Administration; a study particular to California reveals that our state actually has more distracted driving occurrences than the national average.
Preventing Car Accidents in California
Rumble lines, guard rails, & electronic warning signs are examples of strategies that have been shown to be reasonably successful in lowering the number of car crashes. Widened shoulders, resurfaced or edged roadway sides with flares and reflective stripes are examples of intersections with signals since auto accidents occur regularly. Driving around curves and hillsides is now considerably safer and simpler thanks to these upgrades.
Technologies that prevent crashes
Automated emergency braking and clever speed adaptation, for example, will significantly reduce auto accidents. When necessary, one can warn the motorist and change their speed. Research indicates that when the car has this safety equipment, it definitely helps. The driver is 33-36 percent less likely to cause an accident by speeding or being distracted from the situation.
Auto accidents will continue to occur, but can be reduced. Prevention is a multifaceted strategy. California highways can become safer because of cutting-edge engineering applications for road infrastructure. Stricter enforcement of traffic laws is obviously mandatory. Such a result can increase driver awareness, enhance training, & implement new technological solutions. All this can avert emergencies.
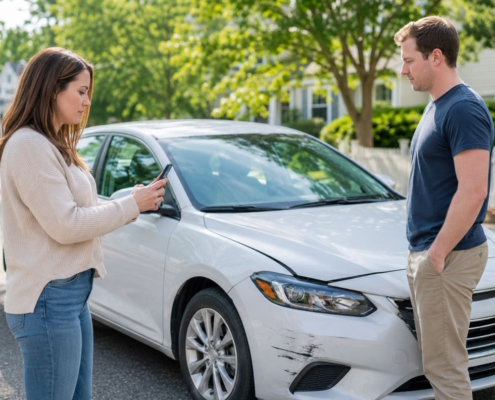
How to Proceed Following an Accident
- After a collision, don’t drive away because this is regarded as “hit and run.” California rules require you to stop following an automobile collision or face severe penalties.
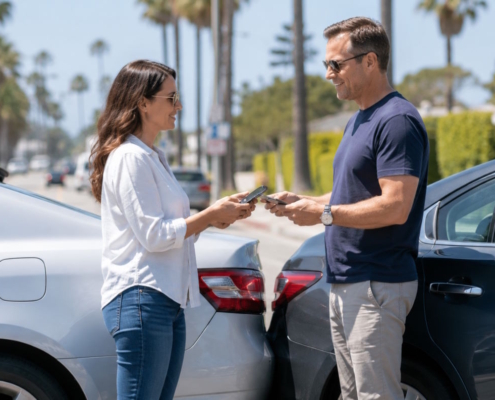
- Give the other motorist your contact information, insurance details, and driver’s license information.
- As required by California law, give victims of auto accidents appropriate assistance—that is, help as anyone with common sense would.
- Notify the state’s Highway Patrol or the Police about the collision so they can file a report right away.
- Before you consider admitting fault or contacting the other party’s insurance company, get a car accident attorney. Let a skilled attorney defend you.
- Sign the tickets you are given at the accident scene. Doing that doesn’t mean that you’re at fault.
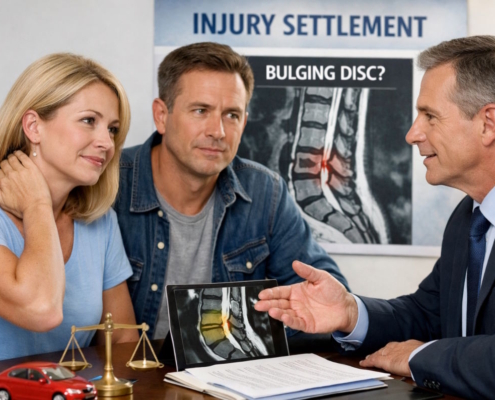
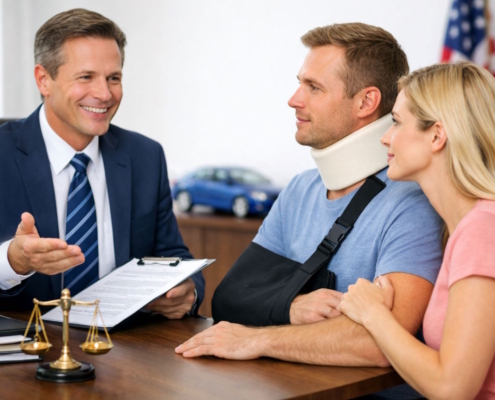
Road-accident injuries: Maximizing your compensation
Working with an experienced personal injury lawyer will improve your chances of winning and optimize your neck injury compensation. A lawyer can aid in cases like this by gathering evidence that the other party’s negligence resulted in your injury and other damages.
To create an indisputable claim for the insurance provider and strengthen your case against responsibility assaults, they will use economists, doctors, private investigators, and accident specialists. A skilled attorney uses both facts & emotion to demonstrate to the judge and jury how the collision affected your life. You can get better advice from a lawyer.
The purpose of an insurance claim or an action for personal injury is to seek damages to compensate for all of your losses. The insurance company or any other liable party will not accept the whole sum of your claim at face value. Presenting the evidence to support your claim can be more difficult than you might imagine.
Because you can show your bills and payment receipts, it is relatively easier to substantiate past medical expenses and lost income. Future losses and non-economic damages, however, are too difficult to measure and demonstrate.
Conclusion
In a state the size of California, auto accidents are extremely prevalent, as the statistics make clear. The state’s roadways, highways, & interstates are continuously traversed by drivers. We always advise driving cautiously. Pay close attention when operating your car to reduce your chance of getting into an accident.
Our team of skilled lawyers is available to assist you if you ever happen to be involved in an automobile accident and require a California attorney for your case. We will go above and beyond to make sure you have the result you want from the beginning to the end of your case. We can also assist you if you have been in a motorcycle or large truck accident.